Google launched Lighthouse in 2016, giving developers an easy way to evaluate their site’s performance, core web vitals, and accessibility—using a single number. The idea was that it would eliminate the need to pore over data and dozens of metrics by delivering just one number that would help website owners determine how a user would perceive their website—including whether they’d navigate away due to a slow page load time.
Since then, aiming for the elusive Google Lighthouse score of “100” has become the all-consuming goal of developers and online store owners alike, with a particular fixation on improving website loading speed.
There’s no question that website speed is important. It’s the first thing consumers experience when they visit your site, and it can leave a lasting impression. That’s not all; starting in May 2021, Google will start evaluating and ranking sites based on page experience, with one of the key factors being website load time.
But relying on a singular Google Lighthouse score to determine your store’s conversion rates—and ultimately your revenue—may be holding you back. Here’s why you need to stop focusing solely on 100 in 2021.
Why are we aiming for site speed scores of 100 anyway?
Back in 2006, Amazon found that just 100 milliseconds of extra load time cost them 1% in sales—the equivalent of well over a billion dollars lost annually. Since then, there have been countless other studies that indicate consumers are an impatient lot. Take, for example, Google’s study that shows slowing search results by four-tenths of a second resulted in a loss of eight million searches per day.
Over the next decade, this type of research spun out of control, and with it, our fixation on site speed intensified.
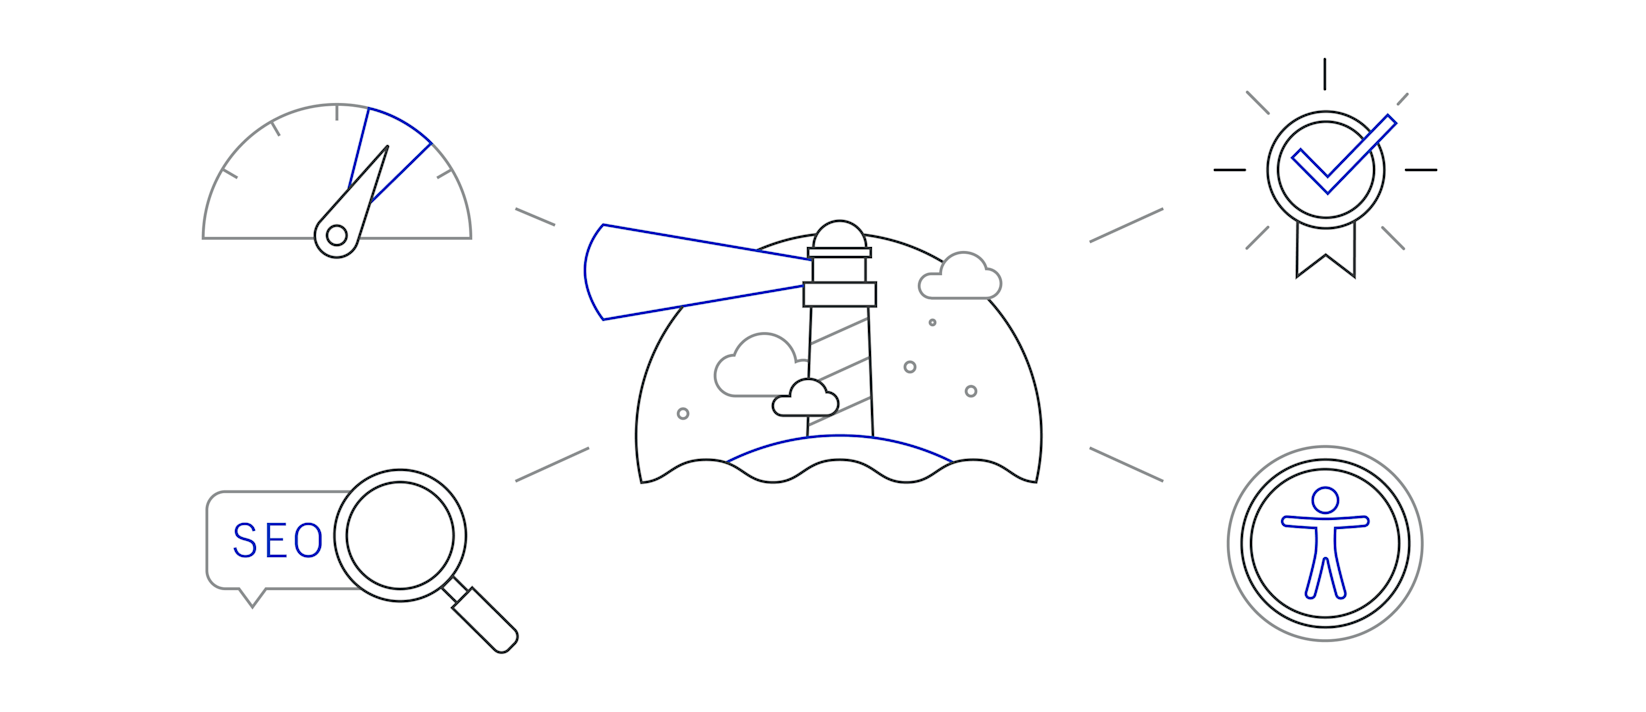
Enter Google PageSpeed Insights, and later, the more all-encompassing Google Lighthouse, a tool that analyzes your site based on several factors: performance, SEO, best practices, and accessibility. Performance simply is the heaviest contributor to the score.
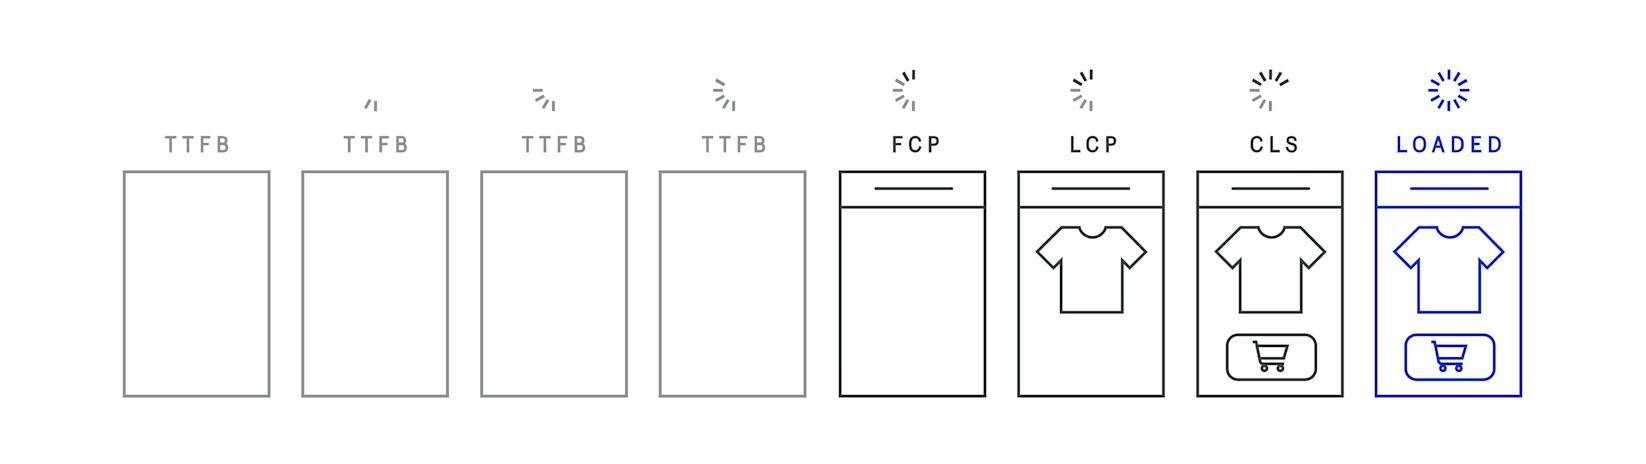
When you double click into performance, Google measures:
- First contentful paint (FCP): When the browser renders the first bit of content from the document object model (DOM), giving the feedback to the user that the page is loading
- Largest contentful paint (LCP): LCP approximates when the main content of the page is visible to users
- Speed index: Measures how quickly content is visually displayed during page load. Lighthouse captures a video of the page loading in the browser and calculates the visual progression between frames
- Total blocking time (TBT): Measures the amount of time that a page is blocked from responding to user input, such as mouse clicks, screen taps, or keyboard presses
- Time to interactive (TTI): Measuring load responsiveness. It helps identify cases where a page looks interactive but actually isn't. A fast TTI helps ensure that the page is usable.
- Cumulative layout shift (CLS): Quantify how often users experience unexpected layout shifts—a low CLS helps ensure that the page is visually stable
LCP is currently weighted the heaviest in the score, but in the May 2021 update, Google will place a larger emphasis on time to interactive, a metric that measures page experience based on core web vitals including mobile-friendliness, safe browsing, HTTPS security, and intrusive interstitial guidelines.
While Google Lighthouse offered a creative solution to a problem, its website speed tests were built with inherent flaws.
First, the audit tool has a first-visit bias. What this means is that your page load speed test is based on a user who is visiting it for the first time only, before any part of your site has been cached by their browser.
The problem is that most consumers don’t shop this way. One study found that 92% of consumers visiting a website for the first time aren’t there to buy anything. Unlike in-store shoppers, online shoppers are considerably less likely to make impulse purchases—they’re much more likely to read reviews and compare prices or features before buying. They’ll likely visit your site multiple times—as many as nine times—before making their purchase. And by that time, the site is fully cached and the site speed time will have improved significantly compared to Google Lighthouse’s original analysis.
That’s not the only problem. Its target of 100 for websites is both moving and an intentionally unattainable web vitals metric. (At Shopify, we’ve heard of more than one online store that had a score of 20, only to reinvest in an expensive rebuild and end up with a score of 25.) There may be sites out there that hit 100, but they’re gaming the system—and it’s unlikely their site is engaging its users.
My colleague Colin Bendell compares a site with a score of 100 to a fruit stand on the side of the road: It’s simple, fast, and likely static. All you have to do is get out of your car, hand over some money, and walk away with your purchase. But chances are, there’s only one kind of fruit on-offer and if it’s bruised, tough luck.
For your typical shopper—who is reading reviews, comparing the price of seasonal fruits, and carefully considering what type of fruit is best for their pie—a farmgate isn’t going to cut it. They want a dynamic experience, so they head to the supermarket, where they’re going to have to find the items, line up, scan the items, bag the items, and leave. Ultimately, the process takes more time, but they’re willing to do it for a better product and experience.
In the case of ecommerce stores, this means enhancing your user’s experiences by installing integrations like help agents or push messaging. These third-party plug-ins will pull down your Google Lighthouse score, but they’ll also result in a better user experience—and potentially in higher revenue.
As a business, you have complete control over the following performance metrics:
- Server response time or time to first bye (TTFB): The liquid theme files dictate how long it takes for the Shopify server to render your page
- FCP or LCP: The amount of scripts and CSS in the critical rendering path
- CLS: Crafting of CSS so that layout doesn’t change during load
- TBT: Ensuring scripts don't generate too many long tasks (long tasks are executed by JavaScript that take more than 50 ms)
How to measure your site’s success
That brings us to the biggest problem, which isn’t with Google Lighthouse’s functionality. The problem is with how the tool has altered our perception of a site’s success, and how we evaluate its overall performance.
Google Lighthouse simulates a visit to one page of your site and attempts to gauge the perception of speed by looking at a few key metrics. At Shopify, we’ve built upon this tool to bring you the online store speed score but made a few tweaks to have a greater representation of your site rather than just the home page.
It’s worth noting that if your online business is on Shopify, the site speed score in your admin may look lower than the Google score since it is based on the Lighthouse scores from three types of pages: home, collection, and product. Collection and product pages are weighted heavier in the final score than the home page based on the proportions of pageviews to those types of pages.
We also only show the mobile score, which tends to be lower than the desktop score, to encourage our merchants to build with mobile shoppers in mind. 67% of sales were made on mobile devices versus 33% on desktop during Black Friday Cyber Monday (BFCM) in 2020.
But you need to also consider real user data and other business value metrics, instead of simply the simulated page browsing. Instead of relying on a Google Lighthouse score or site speed alone, determining whether your site is successful—and profitable—should be based on a holistic data analysis.
After making optimizations to your site, take a look at these business metrics:
- Pageviews and sessions: Are more users browsing?
- Average pageviews per session: Are your users staying on your website longer?
- Number of add to carts per session: Are your users interacting with the cart more often?
- Checkout funnel: Are more users reaching the checkout?
- Number of transactions: Are more users buying?
- Average order value (AOV): Are your users buying more?
Don’t forget to also review these real user monitoring performance (RUM) metrics:
- Server response time (TTFB): Has the communication between Shopify servers improved?
- LCP (if available) or FCP: Can users see your page faster?
Yes, time to first byte (TTFB) is important, but it shouldn’t be the only consideration for building and maintaining an ecommerce store. Instead, I would lean towards investing in a proper review of your raw metrics and real user monitoring metrics.
Finally, I know what the research says. I could rattle off statistics about stores that have claimed there’s a connection between website loading speed and revenue. One second—even one millisecond—could potentially cost you thousands or millions.
But it’s difficult to make a hard association between site speed score and actual business metrics—the two are walking on different paths. The idea that site speed affects revenue is a hypothesis not a fact, and it’s a hypothesis based on oversimplification of the data.
“When I was at eBay, we (User Research and Engineering) tried really hard to show a relationship between site speed and revenue. We just couldn’t do it,” writes computer scientist Christian P. Rohrer on the topic.
Aiming for a site speed score of 100
If you're going to take anything away from reading this, it should be that:
Site speed is just one factor potentially affecting your store’s profit.
But despite the title of this article, that doesn’t mean it’s not important. While you shouldn’t ever expect your site to have a Google Lighthouse score of 100, you should also never give up on trying to hit that magic number.
Let me explain: A score of 100 has become the gold standard because it essentially means your site is healthy. Now, imagine if your site was a person with the goal to become healthy. Starting out, few people would ever claim to be 100% physically and mentally healthy, because it’s a standard that’s impossible to achieve.
Yet, just because we can never be “100% healthy” doesn’t mean we should give up and start eating poutine for dinner every night. It would leave us slow and sluggish. (See where this analogy is going?) Instead, we have to constantly be working towards that goal of 100% through meditation, exercise, and eating balanced meals.
But maybe you’re not training for the Olympics. Maybe you just want to be a perfectly average site that ranks well in SEO. So, what exactly is a realistic Google Lighthouse score?
There’s no quick answer to that question. In the development of a site, I can get scores of 50 to 60. In production, my scores usually land around 30, which makes me cringe—trust me, I don’t like it either. But deep down, I know the site is actually running reasonably fast in terms of a user behavior perspective.
Here’s my advice: When it does come time to check website speed, don’t solely rely on Google Lighthouse. Google Analytics is another useful (and free) tool that evaluates your site speed data and provides suggestions for improvement. I would also suggest paying particular attention to your critical path rendering, which is the process your browser goes through to convert the code into displayable pixels. Speeding this up really elevates user experience on your site and will make your shoppers feel like your site is faster.
“Feel” is the key word there. Ultimately, shoppers don’t know or care what your Google Lighthouse score is. They just care whether your store loads quickly or not, which is a matter of perception. And unfortunately, that’s not always within your control. According to a Google study, state of mind impacts perceptions of speed.
“Users who felt anxious or rushed only around half as likely to perceive pages as fast-loading compared to those who were feeling calm or unhurried,” reports Google, adding that the location from which users access a site—such as from work, while commuting, or while at home—can have an impact. Demographics also play a role in this perception, with younger users being more likely to expect and look for super-fast sites. Different regions and countries also have different standards and expectations in connectivity.
This underscores the truth, which is that the evaluation of metrics and conversion rates is different for every ecommerce merchant. Products and stores are varied and unique, each with a wide range of factors that should be taken into consideration. eBay, for example, has particularly high “time on site,” which is often considered “engagement.” But as Pohrer points out, eBay is a more difficult ecommerce site to figure out, requiring more time on the site. As for Amazon? Customers who visit the marketplace are often ready to make a purchase immediately; when consumers are ready to buy a specific product, nearly three-fourths (74 percent) go to Amazon to do so.
The TL;DR is: Unless you’re Amazon, speeding up your site may not guarantee a return in investment. Instead of relying on studies from other marketplaces or stores, it’s best to start from within. And just like trying to improve your mental and physical health, increasing your conversions and profit can’t be solved by a quick fix or one number—it’s best approached as a holistic endeavor.


